
Collections feel weaker than they should. Visits are steady, the schedule is full, and yet the bank balance does not reflect the work. The instinct is to work harder at the end of the cycle — more calls, more pressure on whoever works the aging report. Sometimes that helps. Often it treats the symptom, because the money was lost weeks earlier, at a step nobody is measuring.
To improve revenue cycle performance, a practice first has to locate the leak. That diagnostic job rests on five measurement points: first-pass rate, denial rate, days in A/R, net collection rate, and the share of A/R over 90 days. Each answers a different question, and read together they point to a specific step — registration, authorization, coding, submission, posting, or follow-up — where revenue is escaping.
Why a single total hides the problem
A monthly collections total tells you what arrived — not what should have arrived, how long it took, or how much work it took to get it. A practice can collect more than last month and still be leaking, simply because volume rose. It can collect less in a month when nothing is broken, because a large payer paid late.
Diagnosis therefore separates five questions a single total blends together. Was the claim right the first time? How often did payers refuse it? How long does money sit unpaid? Of the amount actually owed, how much was collected? And how much has waited so long it may never arrive? Each measure below covers what it measures, what a bad reading points to, and where to look in your own reports.
Three ground rules before you read any report
Use the same definition every month. A rate that changes because the calculation changed tells you nothing. Write down how each measure is calculated and keep it consistent.
Compare your practice with itself. Outside benchmarks are hard to apply fairly — payer mix, specialty, and visit type change what a reading means. Your own trend over several months is the more honest comparison.
Break every measure down. Split each reading by payer, by provider, and where you can, by denial reason or aging bucket. A problem belonging to one payer's authorization rule looks very different from one spread across every payer, and the fix is different too.
1. First-pass rate: was the claim right the first time?
First-pass rate measures the share of claims paid on their first submission, without correction, resubmission, or appeal. It is the cleanest indicator of front-end and mid-cycle quality, because a claim that pays first time was registered correctly, verified, authorized where needed, coded accurately, and formatted as the payer expects.
A falling rate usually points upstream: eligibility checked late or not at all, a missing or expired authorization, demographic errors, or coding that does not match the documentation. Read it alongside your clearinghouse rejection report. Rejections — claims that never reached the payer — often share a cause with first-pass failures, and the rejection report usually names it field by field.
2. Denial rate: how often payers refuse, and why
Denial rate measures how many submitted claims, or how much submitted value, payers deny. On its own it only tells you the size of the problem. Grouped by reason code, it becomes a map. Eligibility denials point to the front desk. Authorization denials point to tracking of approved visits, units, and expiry dates. Coding and medical-necessity denials point to documentation and code selection. Timely-filing denials point to a follow-up process that let a deadline pass.
The habit that matters is grouping. Ten denials with ten different causes is noise; ten sharing one cause is a single fixable step. If your denial report cannot be sorted by reason and payer, that reporting gap is itself the first thing to fix.
3. Days in A/R: how long money takes to arrive
Days in accounts receivable estimates how long, on average, a day's charges take to become payment. It rises when any part of the cycle slows: charges entered late, claims held before submission, denials worked slowly, or follow-up spread too thin to reach every payer.
Read it with the two measures above. If first-pass rate is steady but days in A/R climbs, claims probably pay eventually while follow-up on the exceptions falls behind. If both worsen together, the slowdown is more likely at submission or denial handling. Split it by payer before acting — one slow payer can move the whole average.
4. Net collection rate: did you collect what you were owed?
Net collection rate compares payments received with the amount the practice was contractually owed — charges minus the adjustments your payer contracts require. It answers the question the other measures cannot: after every denial, underpayment, and unworked balance, how much of the collectible money actually arrived?
A weak net collection rate with a reasonable first-pass rate is a telling combination. Claims go out cleanly, so the loss is likely later: underpayments posted without comparison against the contracted amount, denied lines written off instead of appealed, or patient balances billed once and never followed. Read it next to your adjustment report — a growing volume of discretionary write-offs, as distinct from contractual adjustments, is often where the missing percentage sits.
5. A/R over 90 days: what has waited too long
This measure is the share of outstanding receivables older than 90 days. Age is risk: the older a balance, the closer it sits to a filing or appeal deadline, and the harder it becomes to collect. A growing over-90 share usually points to capacity — more follow-up work arriving than the team can clear — or to a pocket of stuck claims nobody owns.
Read the aging report by bucket and by payer, not as one total. Ask of the oldest bucket: Is anyone assigned to it? When was each balance last touched? Which balances approach a deadline that ends the right to appeal or resubmit? Those answers turn a total into a work list.
Reading the five together: combinations that locate the leak
The measures earn their keep in combination:
- Low first-pass rate, high denial rate, normal days in A/R: the front end produces rework, but the back end clears it. Fix registration, eligibility, or authorization checks before adding follow-up staff.
- Good first-pass rate, rising days in A/R, growing over-90 share: claims start clean and then stall. The constraint is follow-up capacity or denial handling speed.
- Acceptable denial rate, weak net collection rate: money is lost quietly at posting — underpayments accepted, adjustments taken without review, or patient balances abandoned early.
- Every measure worse for one payer only: suspect a payer-specific rule change, authorization requirement, or contract issue rather than an internal failure.
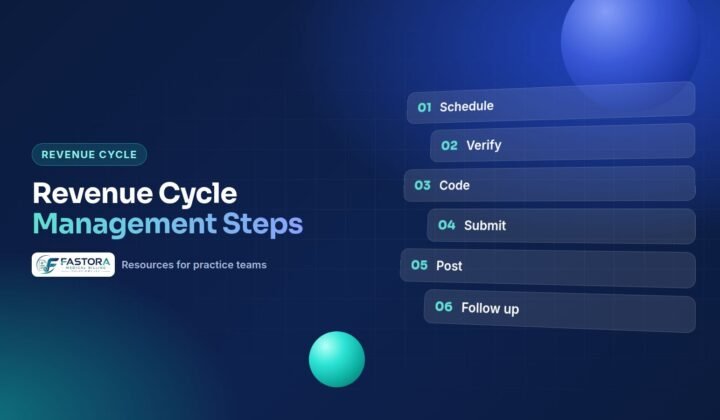
If you want the underlying process in order, our guide to the steps of the revenue cycle walks through each stage; this article's job is narrower — using the numbers to decide which stage to examine first.
Which service addresses which leak
Diagnosis is only useful if each finding has an owner:
- First-pass and eligibility-driven denial problems belong to front-end work: eligibility verification, prior authorization tracking, and pre-submission claim review.
- Coding-related denials belong to coding review and the feedback loop that returns documentation problems to the clinician who can correct them.
- Denial volume and slow handling belong to denial management — a queue sorted by reason and deadline, with recurring causes reported back to the step that produced them.
- Rising days in A/R and a growing over-90 share belong to A/R follow-up, prioritized by age, value, and filing deadlines.
- A weak net collection rate belongs to payment posting done line by line, with underpayments flagged against the contract rather than adjusted away, supported by analytics and reporting work that keeps all five measures visible.
Fastora's revenue cycle management services are organized along those same lines, so a practice can hand off the stage that is leaking rather than replacing everything at once. Match the service to the measured problem, not to the loudest symptom.
What a revenue cycle assessment adds
A practice can run the five measures above from its own reports, and many should start there. A structured revenue cycle assessment adds an outside read of the same evidence: denials sampled at claim level, aging by payer, payments compared with contracted amounts, and measures calculated on consistent definitions where in-house reports conflict. It also tests the explanations — a high denial rate blamed on one payer either survives a claim-level sample or it does not.
Insist on the same output either way: the measure, the step it points to, the evidence, and the fix proposed — in that order. Findings without evidence are opinions, and fixes without a named step rarely hold.
Start with the measure, not the remedy
Practices rarely lose money everywhere at once. They lose it at one or two steps, and the loss shows up downstream as slow cash, heavy rework, or balances quietly written off. The five measurement points will not fix any of that by themselves, but they tell you where to look — and afterward, whether the fix worked. That is what it takes to improve revenue cycle performance: measure honestly, locate the leak, fix that step, and measure again.
If you would like an outside diagnostic before deciding what to change, Fastora offers a free medical billing audit that reviews denial patterns, aging, and collections against the measures described here. There is no obligation attached to the findings — you can act on them with your own team or with ours.
Frequently asked questions
What are the most important revenue cycle KPIs for a medical practice?
Five measures cover most diagnostic work: first-pass rate, denial rate, days in A/R, net collection rate, and the share of A/R over 90 days. Together they show whether claims start cleanly, how often payers refuse them, how long payment takes, how much of the amount owed is collected, and how much has aged into risk.
How do I know where my practice is losing revenue?
Calculate the five measures on consistent definitions, break each down by payer and provider, and look for combinations. A low first-pass rate points upstream to registration, eligibility, or coding. A weak net collection rate with clean claims points to posting and underpayments. A growing over-90 share points to follow-up capacity.
How often should revenue cycle KPIs be reviewed?
Monthly is the practical minimum, compared against the previous several months so trends are visible. Denial and rejection reports deserve more frequent attention, because appeal and filing deadlines run whether or not a monthly review has happened.
What is a revenue cycle assessment?
A structured review of billing performance: KPIs calculated on consistent definitions, denials sampled by reason and payer, aging examined by bucket, and payments compared with contracted amounts. Its output should name the step where revenue is leaking, the evidence, and the fix proposed.
Can improving one KPI make another one worse?
Yes, which is why the measures should be read together. Submitting claims faster can lift volume while lowering first-pass rate. Aggressive write-offs can shrink A/R over 90 days while quietly reducing net collection rate. A change that genuinely helps usually improves the related measures, or at least leaves them unchanged.
Do I need to outsource billing to improve revenue cycle performance?
No. Many leaks — eligibility checks skipped at scheduling, authorizations not tracked by units and dates, denial reports never grouped by reason — can be fixed in-house once they are measured. Outsourcing becomes the question when the diagnosis points to capacity, cover, or expertise the practice does not have, or when the same finding recurs despite internal effort.